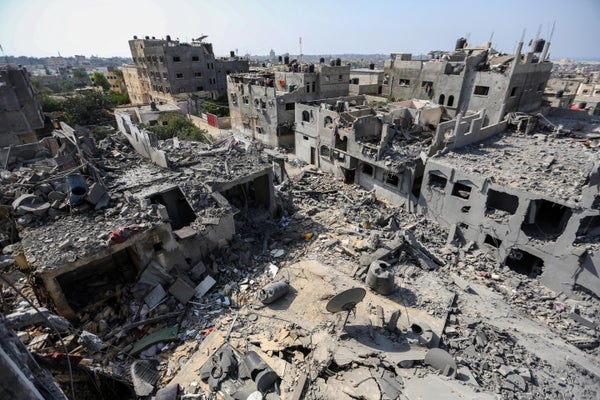
On October 7 Hamas staged a coordinated attack on Israel in which it killed about 1,200 people and captured more than 200 hostages. The Israeli military says that it has struck more than 15,000 targets in the Gaza Strip with bombs and other weapons in the ensuing eight weeks. Israel’s bombardment and siege has killed more than 15,000 people, according to Gaza’s Government Media Office, and the United Nations estimates that the bombing has displaced 1.7 million Palestinians. Bombs have also leveled much of the infrastructure in the small territory, which is 40 kilometers (25 miles) long and 12 km (7.5 miles) across at its widest point. But the exact scope and scale of the destruction has been difficult to quantify, reliable information has been hard to pin down, and disinformation proliferates.
Adding to the uncertainty, up-to-date satellite imagery has become more difficult to access. Some private companies such as Planet Labs and Maxar Technologies, which generally offer optical data to major media outlets and humanitarian organizations, have been restricting images of Gaza. In a statement e-mailed to Scientific American, a Planet Labs spokesperson noted that the company is still sharing medium- and high-resolution data from Gaza with journalists and nongovernmental organizations but that the high-resolution imagery is currently being delayed by 30 days “to reduce the potential for misuse and abuse.” (Maxar Technologies did not respond to a request for comment.) In lieu of timely optical images, researchers have begun to turn to alternative satellite data instead.
One analysis project that has been cited by more than 120 news articles has found that Israel may have damaged or destroyed more than half of all buildings in northern Gaza by mid-November. Rather than using optical images, the assessment relies on publicly available satellite radar data and a specifically developed algorithm to infer building damage. The method, developed by Corey Scher, a Ph.D. candidate at the City University of New York, and Jamon Van Den Hoek, an associate professor of geography at Oregon State University, is a creative scientific solution that is helping journalists and the public peek through the fog of conflict. Scientific American spoke with Scher and Van Den Hoek to learn more about their work and the challenges of measuring the true impact of modern warfare.
On supporting science journalism
If you're enjoying this article, consider supporting our award-winning journalism by subscribing. By purchasing a subscription you are helping to ensure the future of impactful stories about the discoveries and ideas shaping our world today.
[An edited transcript of the interview follows.]
What has your analysis in the Gaza Strip revealed so far?
JAMON VAN DEN HOEK: Every five or six days since the war started, we’ve collected satellite radar data and processed them ... to reveal likely damage to structures. We share those resulting images with journalists and humanitarians. Two weeks ago was the first week where we started seeing our upper-end estimates showing that about 50 percent of structures in northern Gaza are likely damaged.
COREY SCHER: We’ve seen almost a metastatic pattern of damage throughout northern Gaza. If you look at each time step, you’ll see a small cluster of damage, and then it’ll become bigger and bigger, and then there will be other little clusters that pop up, and then those will grow. It’s revealed a striking pace to the extent of damage over time, especially in the north but also in the south.
How do you use radar to assess building damage?
SCHER: Radar illuminates a region with microwaves. The Sentinel-1 satellite constellation sensors that we’re relying on collect data from about 700 kilometers (435 miles) up. The radar wavefront leaves each satellite in a similar way as a camera flash leaving a camera. Then it bounces around in a region and echoes back to the sensor. Those echoes are sensitive to the structure and arrangement of objects on Earth’s surface.
The first step is to get a baseline. We analyze dense stacks of satellite radar data acquired over long periods of time to classify parts of an image as stable. The second step is to monitor those regions we’ve previously classified as stable for signals of destabilization. Then we’ve developed a statistical model to classify potential damage.
How are your images different from those that Google Earth might have on its satellite maps?
SCHER: A satellite map on Google is going to be a very high-resolution optical image, which is different from satellite radar. Satellite radar, instead of looking at a region [from] directly overhead, illuminates it from the side.
Through radar scattering, we can detect everything from tree canopy to city layouts. We don’t know anything about color or the visible light spectrum, but we do have a good idea of how structures might rearrange. As branches and leaves move with each gust of wind, that’s going to change how scattering is happening.
What we send out is a grid of 0’s and 1’s—0 is no damage; 1 is damage. Each file has a different date range of time that it covers. Basically what we share is an abstracted overlay. Journalists can cross-reference that with other datasets and add in context with base maps.
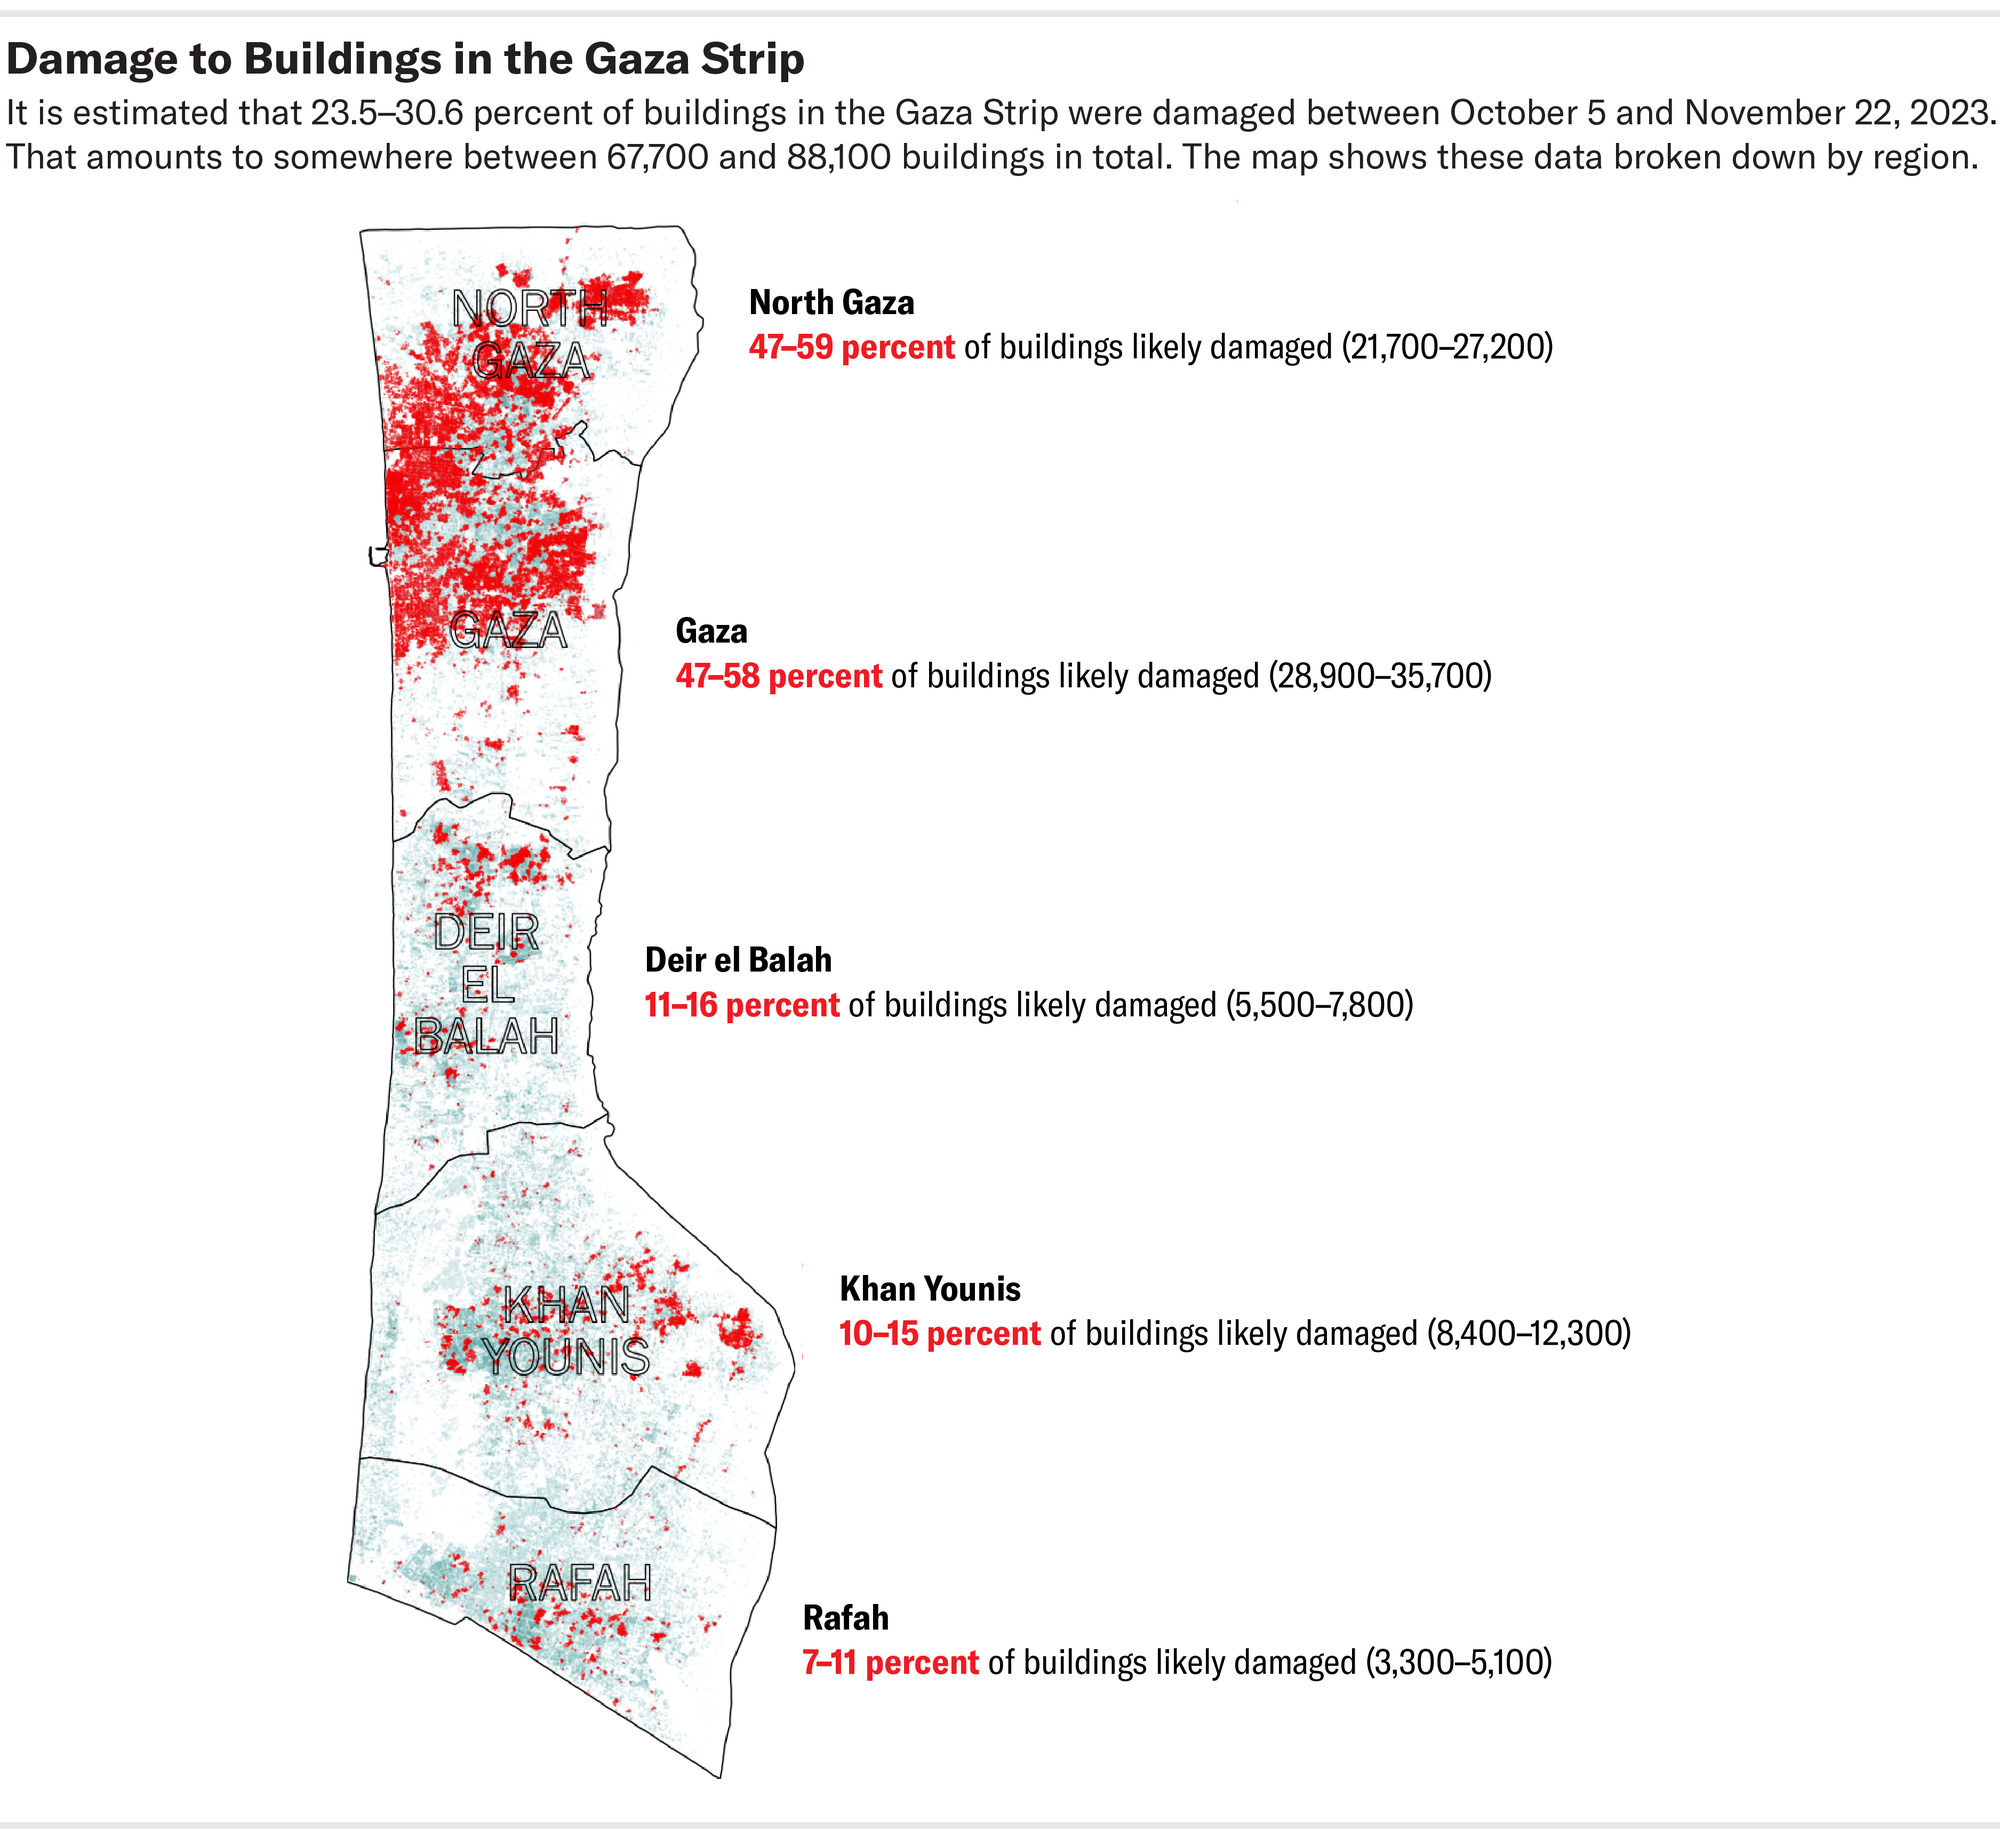
Credit: Jamon Van Den Hoek and Corey Scher; Source: https://www.conflict-damage.org/. (Reproduced with permission.)
What prompted you to develop this technique and assess these data?
VAN DEN HOEK: We’ve been working on this topic of using satellite imagery to understand the effects of armed conflict for a long time. Our motivation comes from concern for vulnerable people subject to the whim of governments’ decisions. We have worked in a bunch of different contexts and conflicts. At every turn, it’s out of concern for the humanity affected by acts of war. We’re also seeking to better understand how war unfolds.
SCHER: Democratizing access to information is another major motivation behind this work. By relying on open data, we can bring a level of transparency and consistency to conflict analysis.
VAN DEN HOEK: Right. So many prior conflicts were obscured. But now we have the scientific foundation to do this, the access to the data and the inclination to analyze it. We don’t need to wait decades for accurate information. We do this during the war in real time.
Your work seems to be filling a void. Why is there a need for this method you’ve developed, even though we have high-resolution optical satellite data that are collected worldwide each day?
SCHER: There are some purely technical reasons. When using satellite radar, we can effectively see through clouds. We can illuminate regions at night. In that sense, we can bring data out under conditions that would classically get in the way of optical image acquisition.
Commercial satellite data providers have also placed some restrictions on optical satellite images out of Gaza, correct?
VAN DEN HOEK: In the current conflict in Gaza, there’ve been substantiated reports of image embargoes. That’s likely because there’s some security concern—perhaps related to troop formations or something that would have an intelligence value. So those images get pulled, and that means that the humanitarian organizations who rely on high-res visual images don’t have those data [as quickly].
In our approach we don’t have to worry about that because everything is open access. And the data that we have can be freely shared—that’s not true with commercial imagery.
Do you worry at all about your images becoming a security risk?
VAN DEN HOEK: I don’t think that that’s going to happen. There’s no precedent for it.
SCHER: We’re limited in the spatial fidelity of what we can detect. Some of those more sensitive details that you might be able to pick out in a 30-centimeter-resolution satellite optical image [are something] we don’t have with the 10-meter resolution of the sensor that we’re using.
When and how did this method emerge?
SCHER: We started developing these methods during the 2021 Israeli bombings in Gaza. We’re drawing on research in geophysical remote sensing. Radar data are used to map things such as the sinking of Mexico City or the California Central Valley and used to monitor snow and ice melt and ecosystem changes such as deforestation. Such data are also key to tracking the aftermath of natural disasters.
Mainly we got here by reading papers about mapping damage after earthquakes. But we are faced with scientific and technical challenges that are unique to conflict.
As an example of that, in an earthquake, if a building is destroyed, it’s going to basically be a pile of rubble. But in military conflict, you might have damage to the side of structures from tanks but not necessarily have a collapsed roof or a flattened building. Because [this type of radar is side-looking], we’re sensitive to some of these damages that you’re not going to be able to see from directly overhead.
Are there limitations?
SCHER: If there’s a house surrounded by vegetation, we might be less sensitive to that, because plants move, and that region of the image isn’t stable enough for our model.
Does that mean your method is inherently a little bit better in cities than it is in rural settings?
SCHER: Yes. The methods perform best in dense urban areas that don’t change much and when there is no snowpack, heavy rain or soil moisture changes. In an area like Gaza, with extremely high urban density and little precipitation, monitoring for potential damage is easier than in geographies like Ukraine.
You mention Ukraine. Can you talk a little bit about where else you’ve deployed this satellite-data-analysis method?
SCHER: We’ve been working for a couple years in Ukraine. The algorithm there is a bit different than what we’re doing in Gaza because of climate differences but also just because of the sheer size of Ukraine and the much longer duration of the conflict. We’ve also applied similar methods recently to monitor conflict impacts in Sudan.
What else should people understand about the work that you’re doing?
VAN DEN HOEK: There’s often this thought that satellite images are objective and that they show the whole truth, but they don’t. Whatever image you see is a consequence of subjective decisions made by a certain person to analyze the data for a certain kind of application.
An image is limited. What happened five minutes before? What happened the day before? You can take a picture of your apartment, but is that the whole truth of your apartment? You may have just cleaned up, or it may be totally trashed after Thanksgiving dinner. The world changes. And in a conflict setting, it really changes fast and in very extreme ways.
We could have just used one image at the beginning of this conflict and then one image at the end of this conflict and done a before-and-after comparison. Sure, that’s helpful, but then we would’ve lost everything in between. We’d have no idea of the process. There’d be no sense of the tempo of the damage.
Even with the data we do have, we know nothing about what’s happening at the human level. We know nothing about what’s happening indoors or underground. We don’t know what’s happening to the atmosphere with the incredible amount of pollutants being produced.
We’ve used this analogy before: satellite images are a prism that enhance and distort. There’s no way that you can get it all in one image or through one method. In understanding landscape change, displacement or potential economic loss, a satellite image is just the tip of the iceberg.
What does the fact that you can’t offer objective images mean for your work?
VAN DEN HOEK: Though we’re making decisions in our analysis, we do strive for neutrality and transparency.
One thing that’s been heartening throughout the past few weeks is that people on all sides of the conflict are looking at the same maps. The fact that everyone is referencing something in a shared space is critical for any sort of peace building or any sort of ability to move on and agree on the facts. Our images were shown on Israel’s Channel 12 News and Al Jazeera. They were both talking about it. That’s powerful. That’s a new kind of—I won’t say truth—but it’s an agreement of an approximation of reality.